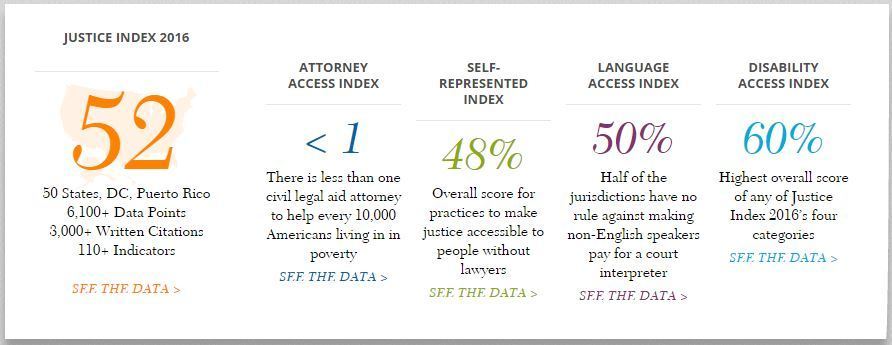
New data released today and a companion website rank the 50 states, the District of Columbia and Puerto Rico on the degree to which they use best practices for ensuring access to justice. Compiled by the National Center for Access to Justice at Cardozo Law School, the Justice Index 2016 paints a dramatic picture of the nation’s justice gap, including the finding that there is less than one civil legal aid attorney for every 10,000 poor people in the United States.
A companion website uses data analytics and data visualization tools to present the data in a variety of maps and graphs that users can manipulate to filter and sort the data. All of the underlying findings and data can be downloaded and specific findings for specific jurisdictions and indicators can be separately downloaded.
States are scored across five indexes: number of attorneys for people in poverty, support for self-represented litigants, support for people with limited English proficiency, support for people with disabilities, and a composite of the other four.
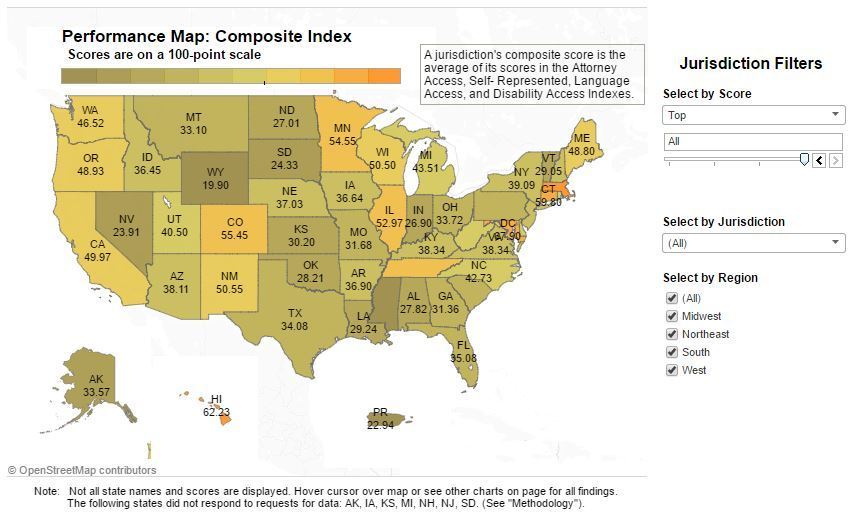
The top-ranked state across all indexes is Massachusetts, followed by Hawaii, Maryland, Connecticut, Colorado, Minnesota, Tennessee, New Mexico and Wisconsin. The top ranking overall goes to the District of Columbia.
The lowest-ranked states, from the bottom up, are Mississippi, Wyoming, Puerto Rico, Nevada, South Dakota, Indiana, North Dakota, Oklahoma and Vermont.
Among the key nationwide findings:
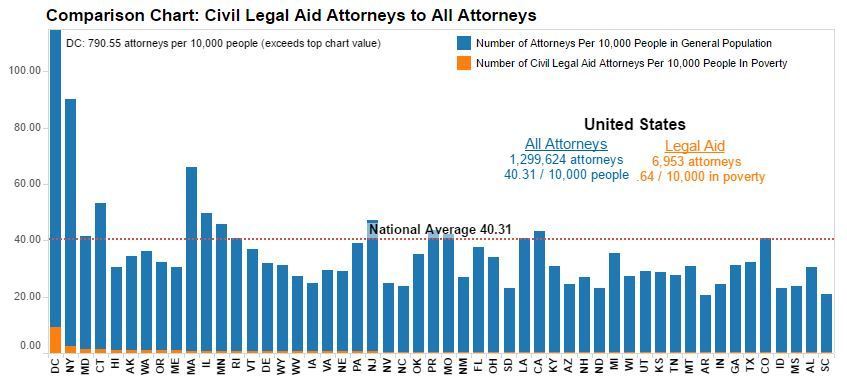
- The nation has an average of .64 civil legal aid attorneys per 10,000 poor people. That compares with 40 lawyers per 10,000 in the general population. Of the nearly 1.3 million lawyers in the U.S., just 6,953 work in civil legal aid.
- Court fees create major obstacles for the poor. Even though a number of states have provisions for waiving court fees for the poor, only 12 states require court staff to tell people that fees can be waived if they can’t afford them.
- States lag in providing mental health accommodations. The vast majority of states fail to help people with mental illness navigate the justice system, the findings show. Only five states have dedicated employees who are trained to assist people in court with mental illness.
The picture is not all bleak, David Udell, executive director of the NCAJ told me during an interview yesterday. The index shows that some states are taking the lead in adopting innovative practices and technologies to improve access to justice. “The index creates a detailed landscape of where the innovation is and where it isn’t,” Udell says.
He is also encouraged by evidence that courts are deepening their commitment to access to justice, such as last year’s adoption by the Conference of Chief Justices of Resolution 5: Reaffirming the Commitment to Meaningful Access to Justice for All.
“The courts have embraced the agenda of making themselves user-friendly,” Udell says. “That includes a big commitment to technology.”
Visualizations and Charts
The Justice Index website presents this data across a series of pages, with one main page for each index. At the top of each page is a performance map that gives a nationwide view and that can be filtered by score and jurisdiction.
The composite-index page includes other charts and graphs showing the composite indexes and scores. The chart for composite indexes includes a column for each subject index. Each of these columns can be reordered by clicking a small icon at the bottom of the column. (It is hard to see, but if you hover over the number 50 at the bottom of a column, the icon appears. Click it once to reverse the ranking, click again to alphabetize the ranking, click again to return to the top-to-bottom ranking.)
Three of the subject index pages include a best practices table showing the indicators that were used to rank the states in that category. These can be filtered by jurisdiction, indicator and finding. For example, in the index covering access for unrepresented litigants, the number 11 indicator is whether the state encourages plain English in the courtroom. You can filter the data to see just the responses to this question, and further filter it to see just the states that answered the question one way or the other.
The attorney-access page includes a list of all the legal aid organizations that were included in the headcount of legal aid attorneys.
This is the second time the NCAJ has compiled the Justice Index. It also did this in 2014. This time, however, it substantially expanded its data collection, going from 44 total indicators in 2014 to 112 this time, and from 2,555 data points in 2014 to 6,148 in this release. It also expanded its research from 742 sources in 2014 to 3,012 this year.
Because of these and other changes, the NCAJ cautions against making direct comparisons between the two sets of findings. The NCAJ plans to repeat the Justice Index at least every two years and Udell said that the indicators and data points should remain more consistent going forward, to provide better points of comparison.
Research for the Justice Index 2016 was overseen by the NCAJ with much of the work done by 37 pro bono attorneys from five law firms: Kirkland & Ellis; Morgan, Lewis & Bockius; O’Melveny & Myers; Patterson Belknap Webb & Tyler; and Simpson Thacher & Bartlett.